Print a Mandelbrot set to the console
A function to generate a Mandelbrot set:
import numpy as np

def mandelbrot_set(
    real_values: np.ndarray[np.float64],
    imag_values: np.ndarray[np.float64],
    max_iterations: int,
) -> list[int]:
    num_real = len(real_values)
    num_imag = len(imag_values)
    escape_counts = np.full((num_imag, num_real), max_iterations, dtype=int)
    for i, imag in enumerate(imag_values):
        for j, real in enumerate(real_values):
            z = complex(0, 0)
            c = complex(real, imag)

            for iter in range(max_iterations):
                if abs(z) > 2.0:
                    escape_counts[i][j] = iter
                    break
                else:
                    z = z * z + c
    return escape_counts
The function initializes a NumPy array with the value of max_iterations. Any complex numbers that
diverge before max_iterations have their iteration counts recorded in the array.
Any numbers that do not diverge before max_iterations are considered to be in the Mandelbrot set.
Note that this doesn’t prove that they are in the set. It’s possible that they would diverge given
more iterations.
The mandelbrot_set function can be called with:
real = np.linspace(-2, 0.5, 20)
imag = np.linspace(1.25, -1.25, 20)

max_iterations = 50
result = mandelbrot_set(real, imag, max_iterations)
print(result)
Example output:
[[ 1  1  1  1  2  2  2  2  3  3  3  3  3  3  3  3  2  2  2  2]
 [ 1  1  1  2  2  2  3  3  3  3  3  3  4  4  6  4  3  3  2  2]
 [ 1  1  2  2  3  3  3  3  3  3  4  4  4  5  9 19  4  4  3  3]
 [ 1  1  2  3  3  3  3  3  3  4  4  4  5 26 19 11  5  4  4  3]
 [ 1  1  3  3  3  3  3  3  4  4  5  7  7 10 50 50  8  6  5  3]
 [ 1  2  3  3  3  3  3  4  5  5  6 25 50 50 50 50 50 13 28  4]
 [ 1  3  3  3  3  4  6  5  5  6 25 50 50 50 50 50 50 50  9  5]
 [ 1  3  4  4  5  6 12 10 10  9 50 50 50 50 50 50 50 50 50  6]
 [ 1  4  4  5  5  7 15 50 50 38 50 50 50 50 50 50 50 50 50  5]
 [ 1  5  7  6  8 45 50 50 50 50 50 50 50 50 50 50 50 50  9  5]
 [ 1  5  7  6  8 45 50 50 50 50 50 50 50 50 50 50 50 50  9  5]
 [ 1  4  4  5  5  7 15 50 50 38 50 50 50 50 50 50 50 50 50  5]
 [ 1  3  4  4  5  6 12 10 10  9 50 50 50 50 50 50 50 50 50  6]
 [ 1  3  3  3  3  4  6  5  5  6 25 50 50 50 50 50 50 50  9  5]
 [ 1  2  3  3  3  3  3  4  5  5  6 25 50 50 50 50 50 13 28  4]
 [ 1  1  3  3  3  3  3  3  4  4  5  7  7 10 50 50  8  6  5  3]
 [ 1  1  2  3  3  3  3  3  3  4  4  4  5 26 19 11  5  4  4  3]
 [ 1  1  2  2  3  3  3  3  3  3  4  4  4  5  9 19  4  4  3  3]
 [ 1  1  1  2  2  2  3  3  3  3  3  3  4  4  6  4  3  3  2  2]
 [ 1  1  1  1  2  2  2  2  3  3  3  3  3  3  3  3  2  2  2  2]]
The pattern defined by the value 50 is a small approximation of the Mandelbrot set.
Styling the output with Textualize Rich library #
Documentation: Textualize/rich
import numpy as np
from rich import print
from rich.panel import Panel
from rich import box

# ... same mandelbrot_set definition as in the code above

real = np.linspace(-2, 0.5, 20)
imag = np.linspace(1.25, -1.25, 20)

max_iterations = 50
result = mandelbrot_set(real, imag, max_iterations)


mandelbrot_repr = ""
for row in result:
    row_repr = ""

    for count in row:
        count_str = str(count)
        countstr_len = len(count_str)
        for char in range(4 - countstr_len):
            count_str += " "

        if count == max_iterations:  # allows for setting a specific color for the set
            color_code = 129
            style = "bold"
        else:
            color_code = count
            style = "bold"

        # it's convenient that standard terminal color codes can be used:
        count_str = (
            f"[color({color_code}) {style}]{count_str}[/color({color_code}) {style}]"
        )
        row_repr += count_str

    mandelbrot_repr += f"{row_repr}\n"

print(Panel(mandelbrot_repr, title="Mandelbrot set", expand=False, box=box.DOUBLE_EDGE))
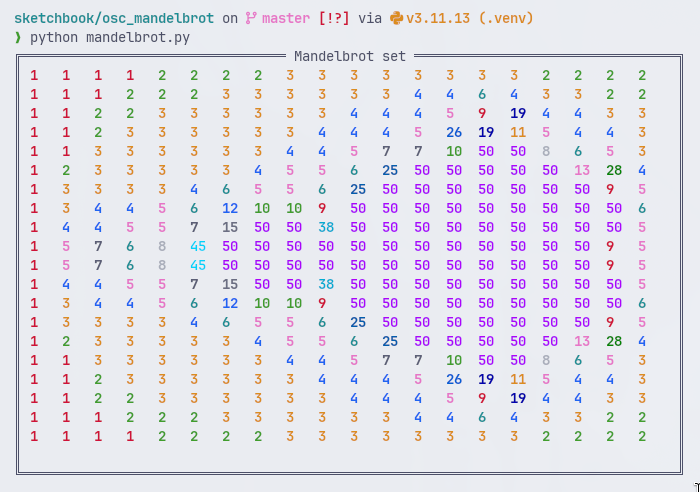
Output in the terminal (the colors aren’t preserved when copied and pasted to this note):
╔═════════════════════════════════ Mandelbrot set ═════════════════════════════════╗
║ 1   1   1   1   2   2   2   2   3   3   3   3   3   3   3   3   2   2   2   2    ║
║ 1   1   1   2   2   2   3   3   3   3   3   3   4   4   6   4   3   3   2   2    ║
║ 1   1   2   2   3   3   3   3   3   3   4   4   4   5   9   19  4   4   3   3    ║
║ 1   1   2   3   3   3   3   3   3   4   4   4   5   26  19  11  5   4   4   3    ║
║ 1   1   3   3   3   3   3   3   4   4   5   7   7   10  50  50  8   6   5   3    ║
║ 1   2   3   3   3   3   3   4   5   5   6   25  50  50  50  50  50  13  28  4    ║
║ 1   3   3   3   3   4   6   5   5   6   25  50  50  50  50  50  50  50  9   5    ║
║ 1   3   4   4   5   6   12  10  10  9   50  50  50  50  50  50  50  50  50  6    ║
║ 1   4   4   5   5   7   15  50  50  38  50  50  50  50  50  50  50  50  50  5    ║
║ 1   5   7   6   8   45  50  50  50  50  50  50  50  50  50  50  50  50  9   5    ║
║ 1   5   7   6   8   45  50  50  50  50  50  50  50  50  50  50  50  50  9   5    ║
║ 1   4   4   5   5   7   15  50  50  38  50  50  50  50  50  50  50  50  50  5    ║
║ 1   3   4   4   5   6   12  10  10  9   50  50  50  50  50  50  50  50  50  6    ║
║ 1   3   3   3   3   4   6   5   5   6   25  50  50  50  50  50  50  50  9   5    ║
║ 1   2   3   3   3   3   3   4   5   5   6   25  50  50  50  50  50  13  28  4    ║
║ 1   1   3   3   3   3   3   3   4   4   5   7   7   10  50  50  8   6   5   3    ║
║ 1   1   2   3   3   3   3   3   3   4   4   4   5   26  19  11  5   4   4   3    ║
║ 1   1   2   2   3   3   3   3   3   3   4   4   4   5   9   19  4   4   3   3    ║
║ 1   1   1   2   2   2   3   3   3   3   3   3   4   4   6   4   3   3   2   2    ║
║ 1   1   1   1   2   2   2   2   3   3   3   3   3   3   3   3   2   2   2   2    ║
║                                                                                  ║
╚══════════════════════════════════════════════════════════════════════════════════╝
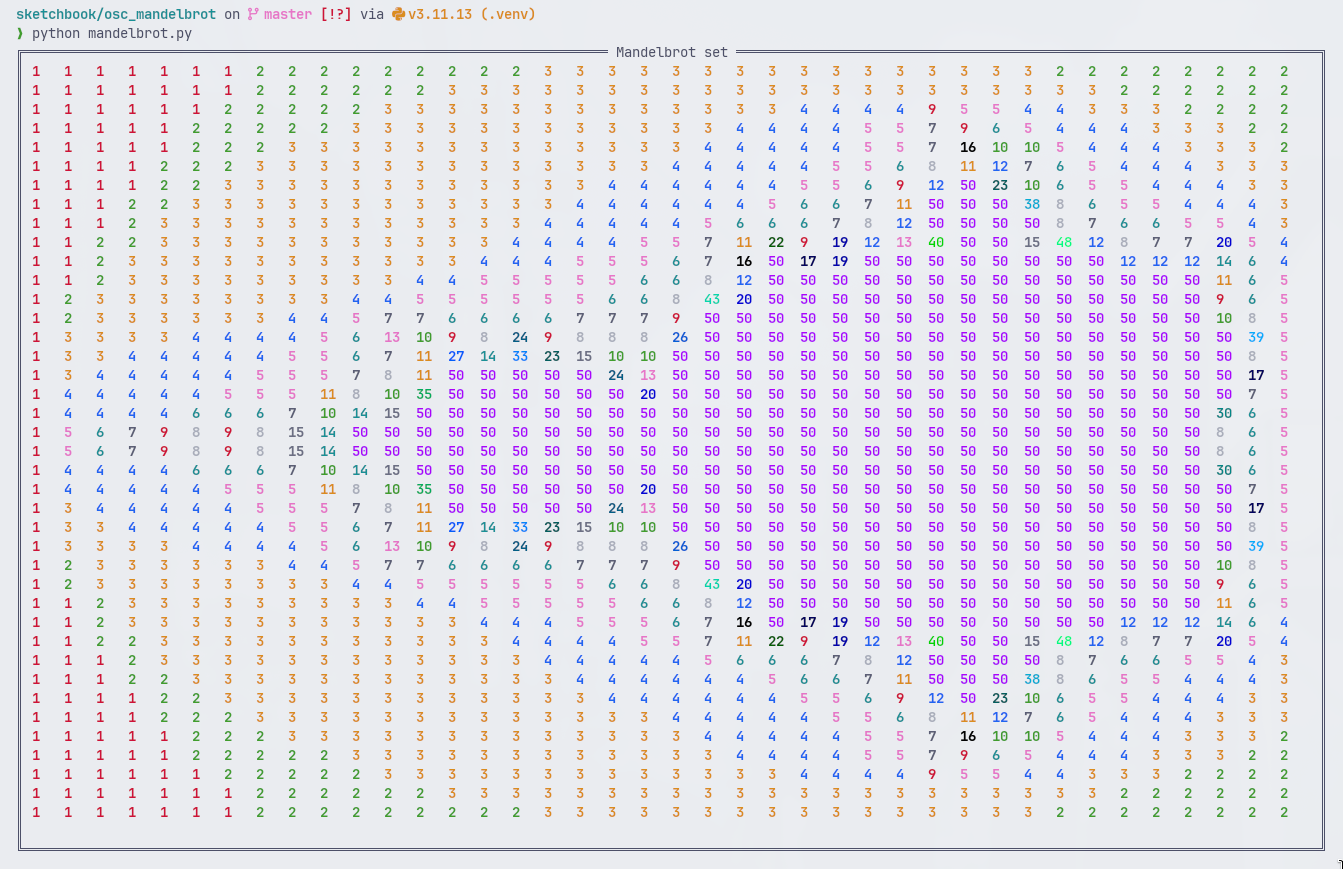
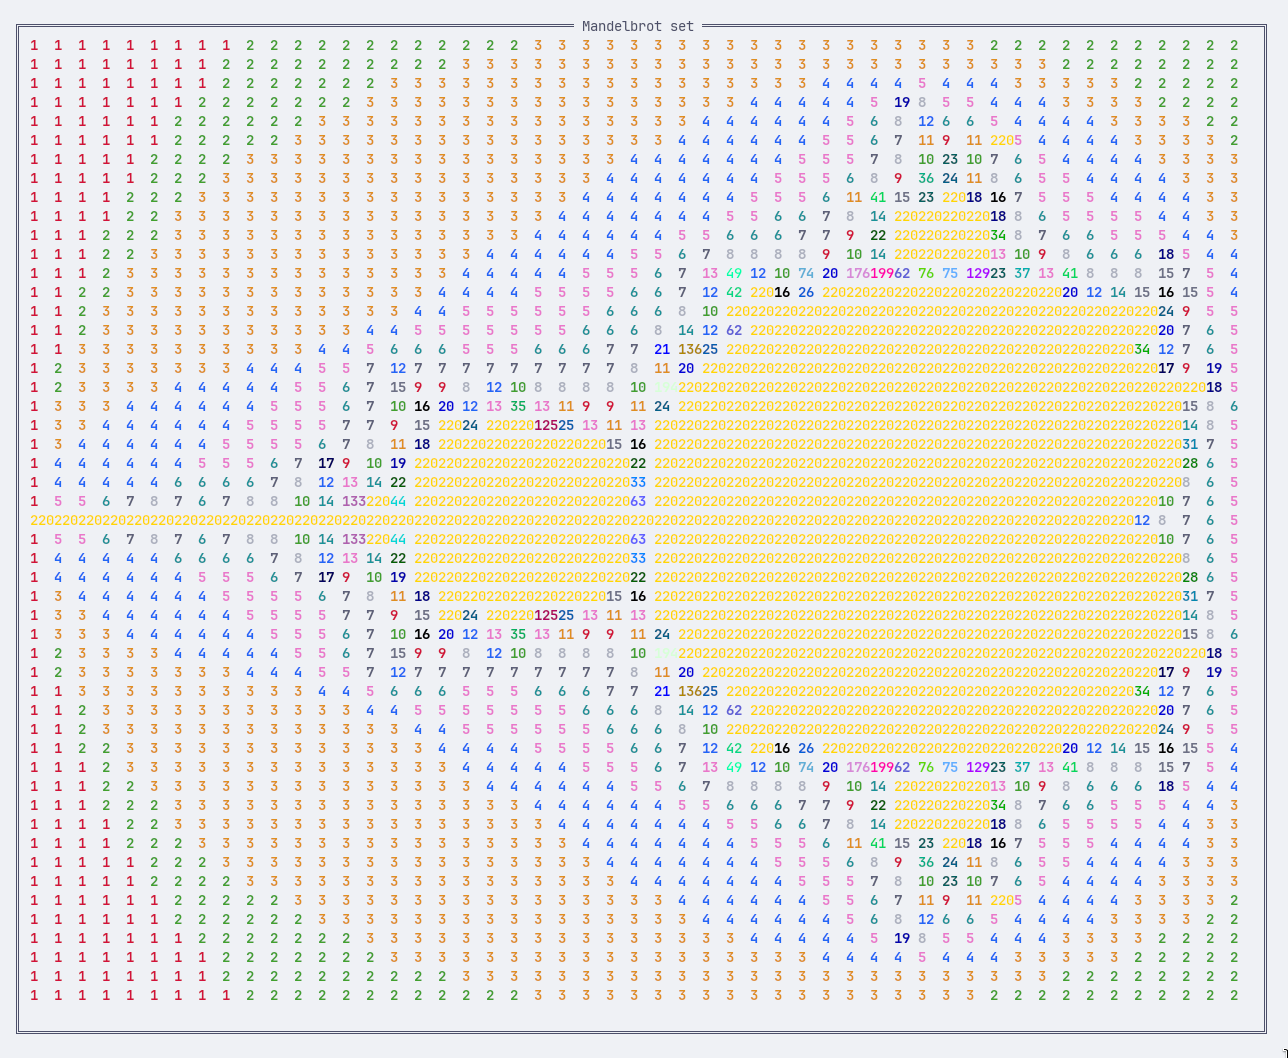
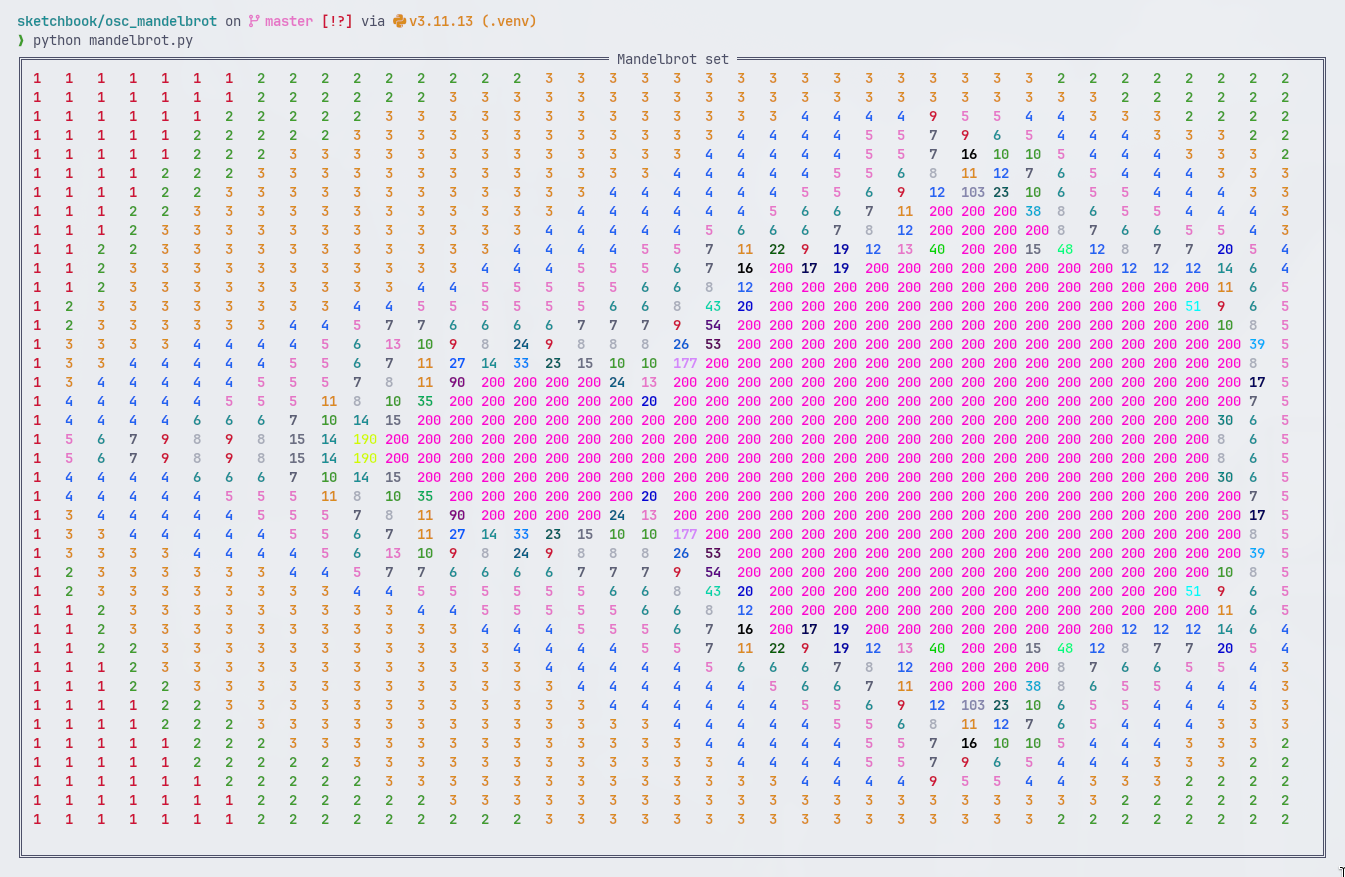
Pushing max_iterations to 200:
A 50x50 set with the spaces removed around three digit iteration counts, so that it renders close to the actual proportions of the real and imaginary domains: