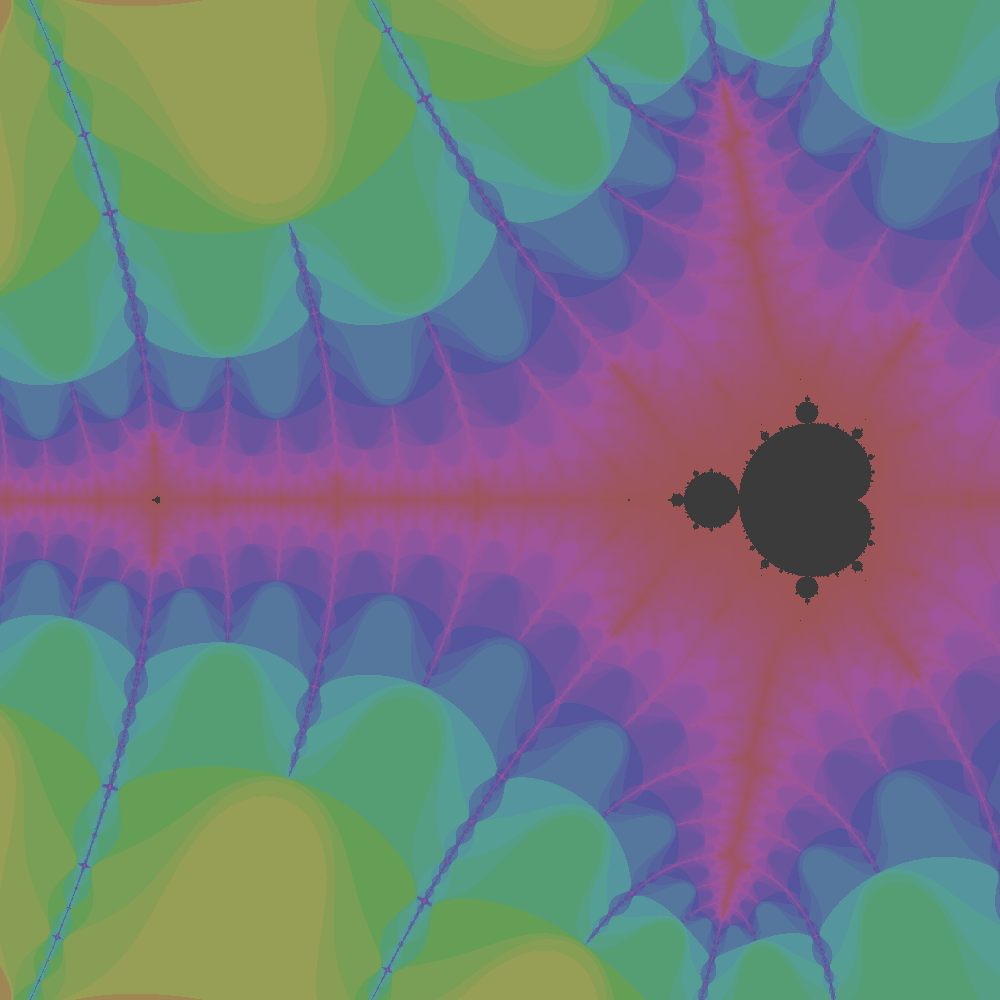
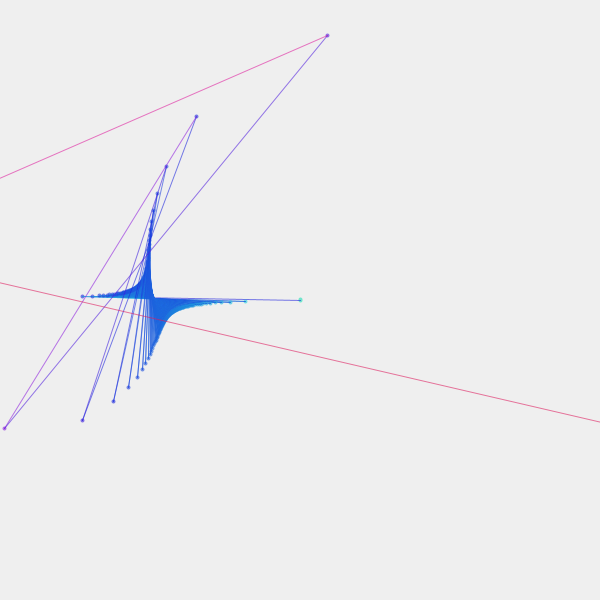
Tracing how numbers change during the Mandelbrot iterations
Related to notes / Multiplying complex numbers
Just the code and some images for now:

Processing code:
import oscP5.*;
import netP5.*;

Complex z;
Complex c;
float rePrev = 0.0;
float imPrev = 0.0;

OscP5 oscP5;
NetAddress myLocation;

float scaleAdjustment;
float zoom = 1.0;
boolean clearBg = false;

void setup() {
  size(600, 600);
  colorMode(HSB, 360, 100, 100);
  background(334, 0, 94);
  oscP5 = new OscP5(this, 12000);
  myLocation = new NetAddress("127.0.0.1", 9000);
  scaleAdjustment = (width/2 - 10) / 4.0;
}

/*
 * interesting points:
 * -0.391+-0.587i (chaotic)
 * -1.25+0.004i (takes a while to escape)
 * -543689+0i (Douady's rabbit (?))
 * 0+1i (a 4 perioc cycle)
 * 0.4711853349333897+0.3541498236351667i (the point with the greatest real coordinate (?)
 * see: https://mrob.com/pub/muency/easternmostpoint.html)
 */
void draw() {
  translate(width/2, height/2);
  scale(1, -1);

  if (clearBg) {
    background(334, 0, 94);
    clearBg = false;
  }

  if (z != null && z.magnitude() <= 8.0 && clearBg != true) {
    float re = z.re * scaleAdjustment * zoom;
    float im = z.im * scaleAdjustment * zoom;
    float magnitude = z.magnitude();
    float hue = map(magnitude, 0, 2.0, 167, 360);
    stroke(hue, 87, 87, 150);
    strokeWeight(4);
    point(re, im);
    strokeWeight(1);
    line(rePrev, imPrev, re, im);
    rePrev = re;
    imPrev = im;
    z = z.mult(z).add(c);
  }
}

void oscEvent(OscMessage message) {
  println("### OSC message received:");

  if (message.checkAddrPattern("/complex/number")) {
    if (message.checkTypetag("ff")) {
      clearBg = true;
      float re = message.get(0).floatValue();
      float im = message.get(1).floatValue();
      c = new Complex(re, im);
      z = new Complex(0.0, 0.0);
      rePrev = 0;
      imPrev = 0;
      println("Updated z to (0.0, 0.0); Updated z to (" + re + ", " + im + ")" );
      OscMessage statusMessage = new OscMessage("/complex/status");
      statusMessage.add(re);
      statusMessage.add(im);
      oscP5.send(statusMessage, myLocation);
    }
  }

  if (message.checkAddrPattern("/complex/zoom")) {
    if (message.checkTypetag("f")) {
      zoom = message.get(0).floatValue();
    }
  }

  if (message.checkAddrPattern("/complex/save")) {
    String reStr = String.format("%.4f", c.re);
    String imStr = String.format("%.4f", c.im);
    String imageName = "complex_" + reStr + "_" + imStr + ".png";
    save(imageName);
    OscMessage statusMessage = new OscMessage("/complex/save/status");
    statusMessage.add(imageName);
    oscP5.send(statusMessage, myLocation);
  }
}
class Complex {
  float re, im;

  Complex(float re, float im) {
    this.re = re;
    this.im = im;
  }

  Complex add(Complex other) {
    return new Complex(re + other.re, im + other.im);
  }

  Complex mult(Complex other) {
    return new Complex(
      re * other.re - im * other.im,
      re * other.im + im * other.re
      );
  }

  float magnitude() {
    return sqrt(re*re + im*im);
  }
}
Python OSC server:
from pyliblo3 import ServerThread, send, make_method, Address

_server = None
# the address the client is listening on
processing = Address("localhost", 12000)


# starts the server; intended to be run from the REPL with start_listening()
def start_listening(port=9000, verbose=True):
    global _server

    class InteractiveServer(ServerThread):
        @make_method("/complex/save/status", "s")
        def save_status_callback(self, path, args):
            filename = args
            print(f"\u2190 Image saved: {filename}")

        @make_method("/complex/status", "ff")
        def status_callback(self, path, args):
            re, im = args
            print(f"\u2190 Received status update, re: {re}, im: {im}")

        @make_method(None, None)
        def fallback(self, path, args):
            print(f"\u2190 {path} {args}")

    _server = InteractiveServer(port)
    _server.start()
    print(f"Listening on port {port}")


def osc(address, *values):
    print(f"\u2192 {address} {values}")
    send(processing, address, *values)
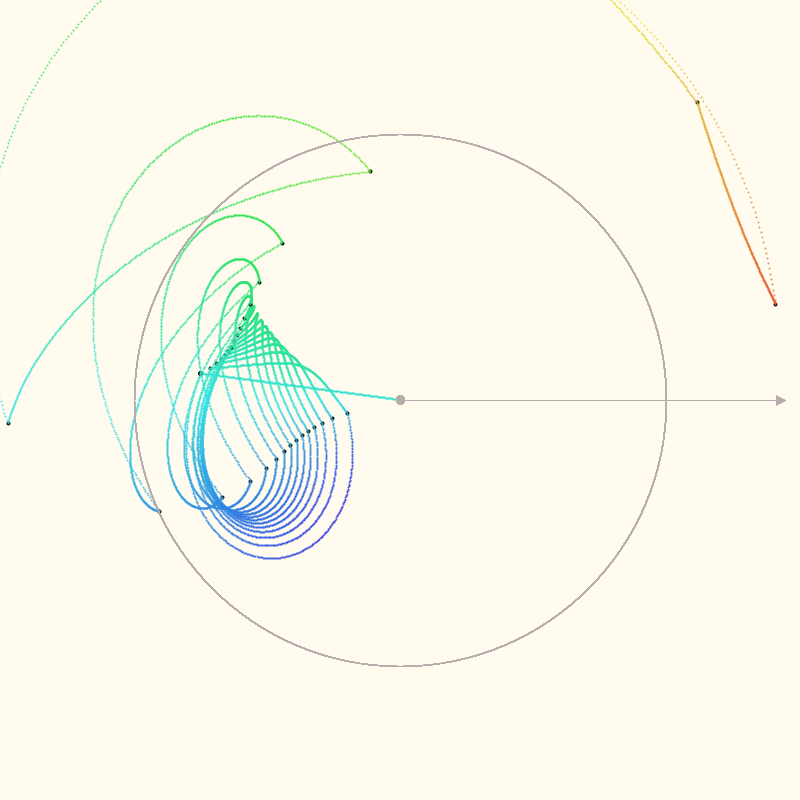
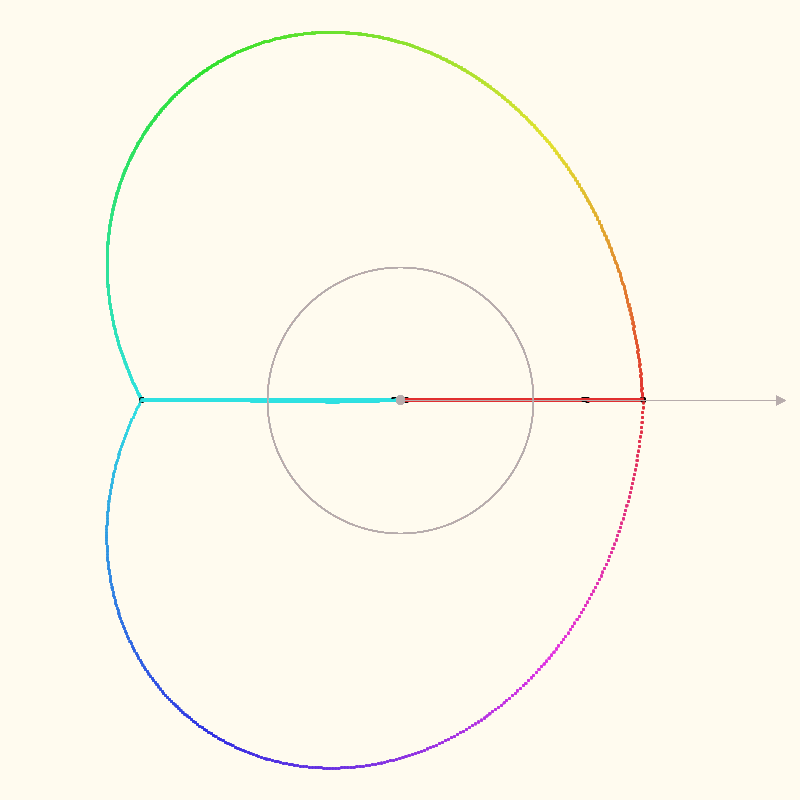
Interpolating the Mandelbrot iterations #
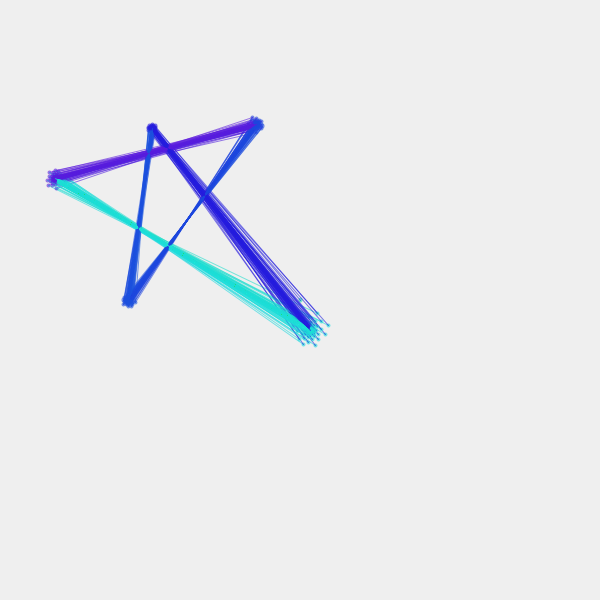
The paths that are mapped in the above section don’t seem right to me. Multiplying complex numbers scales and rotates the number’s position. This shouldn’t result in straight lines.
This seems closer to what’s actually going on. The code pre-calculates the values of z for each
iteration, then steps through the calculated values to interpolate the intermediate points, based on
the value of t (range (0-1)).
This took some trial and error:
float wS;
float twoWs;
color bg;
color text;
color grid;

ArrayList<ComplexPolar> iterationTargets = new ArrayList<ComplexPolar>();
int currentIteration = 0;
int maxIterations = 100;
double threshold = 4.0;

ComplexPolar zStart = new ComplexPolar(0, 0);
ComplexPolar zInter;
double x = -1.5437;
double y = 0.0;
ComplexPolar c = fromCartesian(x, y);

float dt = TWO_PI * 0.0005;
float t = 0;

void setup() {
  size(800, 800);
  colorMode(HSB, 360, 100, 100, 100);
  bg = color(48, 6, 100);
  text = color(0, 6, 6);
  grid = color(0, 6, 72);
  background(bg);
  wS = width / 5;
  twoWs = wS * 2;
  calculateTargets(c);
}

void draw() {
  translate(width/2, height/2);
  scale(1, -1);

  polarPlot();  // draws the unit circle and polar axis;

  if (currentIteration == 0) {
    strokeWeight(4);
    stroke(0, 0, 0);
    // draw the first target:
    ComplexPolar target = iterationTargets.get(0);
    point((float)target.re()*wS, (float)target.im()*wS);
  }

  if (currentIteration < iterationTargets.size()) {
    zInter = zStart.mult(zStart.power(t)).sum(c.scalarMult(t));
    float hue = zInter.hue;
    stroke(hue, 79, 89, 75);
    strokeWeight(2);
    point((float)zInter.re()*wS, (float)zInter.im()*wS);
  } else {
    println("Iterations complete");
    String filename = "mandelbrot_point_" + String.format("%.4f", x)+"_"+String.format("%.4f", y)+".png";
    save(filename);
    noLoop();
  }

  t += dt;
  if (t >= 1.0 && currentIteration < iterationTargets.size()) {
    println("current iteration:", currentIteration);
    t %= 1;
    // set zStart to the pre-calculated starting value for the next
    // iteration:
    zStart = iterationTargets.get(currentIteration);

    currentIteration++;
    // display the next target:
    if (currentIteration < iterationTargets.size() - 1) {
      ComplexPolar target = iterationTargets.get(currentIteration);
      stroke(0, 0, 0);
      strokeWeight(4);
      point((float)target.re()*wS, (float)target.im()*wS); // next target
    }
  }
}

void polarPlot() {
  stroke(grid);
  strokeWeight(1);
  noFill();
  ellipse(0, 0, 1*twoWs, 1*twoWs);
  line(0, 0, width/2 - 16, 0);
  fill(grid);
  triangle(width/2 - 16, 0, width/2 - 24, 4, width/2 - 24, -4);
  strokeWeight(8);
  point(0, 0);
  strokeWeight(1);
}

void calculateTargets(ComplexPolar c) {
  ComplexPolar z = new ComplexPolar(0, 0);
  for (int i = 0; i < maxIterations; i++) {
    if (z.magnitude() > threshold) {
      break;
    }
    z = z.mult(z).sum(c);
    iterationTargets.add(z);
  }
}

ComplexPolar fromCartesian(double x, double y) {
  double r = Math.sqrt(x*x + y*y);
  double theta = Math.atan2(y, x);
  return new ComplexPolar(r, theta);
}

public class ComplexPolar {
  double r, theta;
  int hue;  // used to associate a color with an angle

  ComplexPolar(double r, double theta) {
    this.r = r;
    this.theta = theta;
    double thetaNorm = theta % TWO_PI;
    if (thetaNorm < 0) thetaNorm += TWO_PI;
    this.hue = (int)(thetaNorm * 180/PI);
  }

  ComplexPolar mult(ComplexPolar other) {
    return new ComplexPolar(r * other.r, theta + other.theta);
  }

  ComplexPolar scalarMult(float t) {
    return new ComplexPolar(r * t, theta);
  }

  ComplexPolar power(double n) {
    return new ComplexPolar(Math.pow(r, n), theta * n);
  }

  ComplexPolar sum(ComplexPolar other) {
    double real = this.re() + other.re();
    double imag = this.im() + other.im();
    double r = Math.sqrt(Math.pow(real, 2) + Math.pow(imag, 2));
    double theta = Math.atan2(imag, real);

    return new ComplexPolar(r, theta);
  }

  double magnitude() {
    return r;
  }

  double re() {
    return r * Math.cos(theta);
  }

  double im() {
    return r * Math.sin(theta);
  }
}
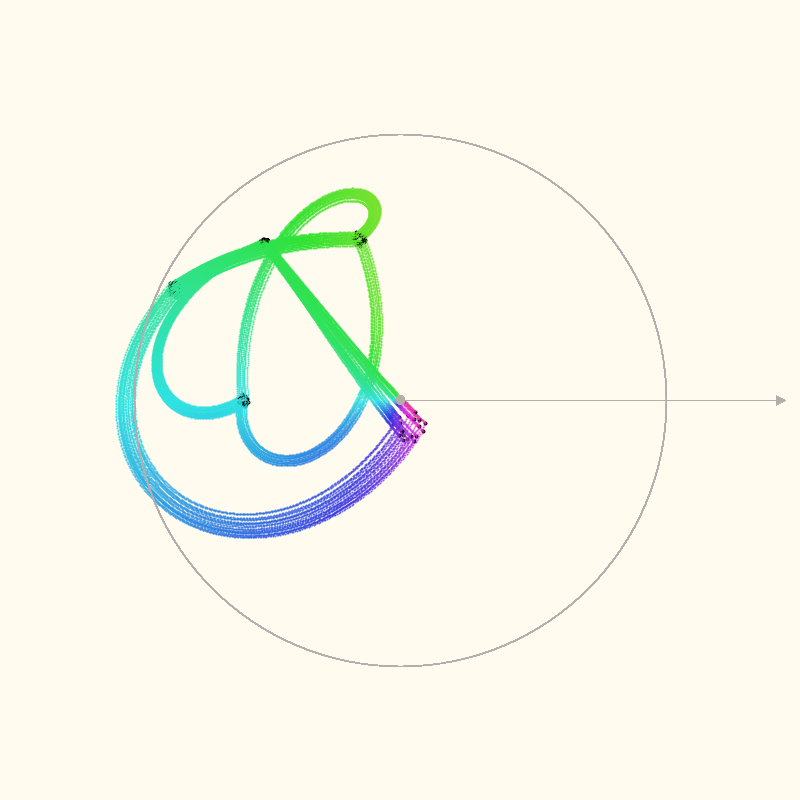
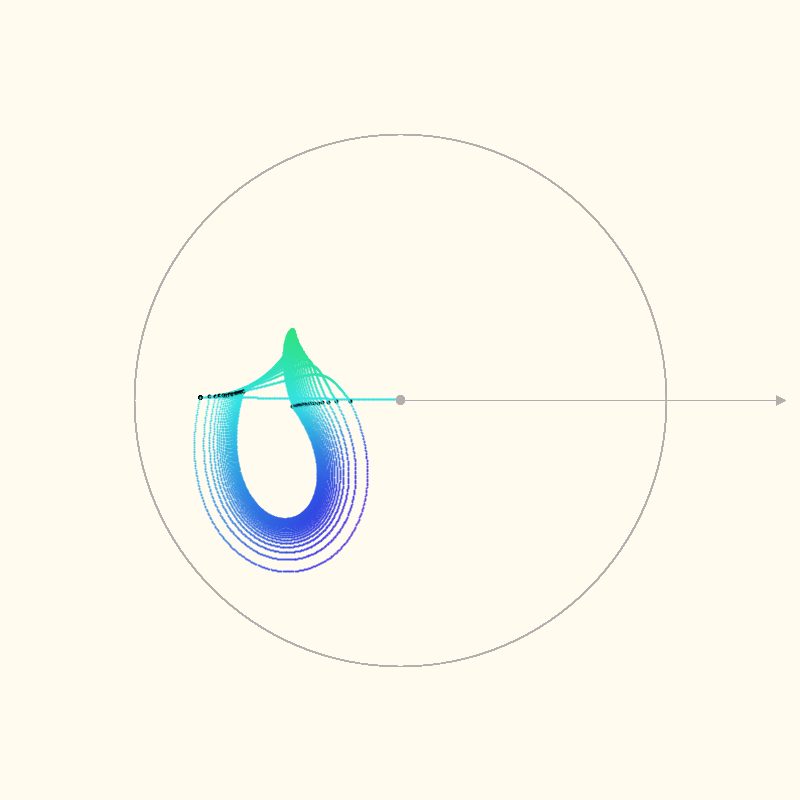
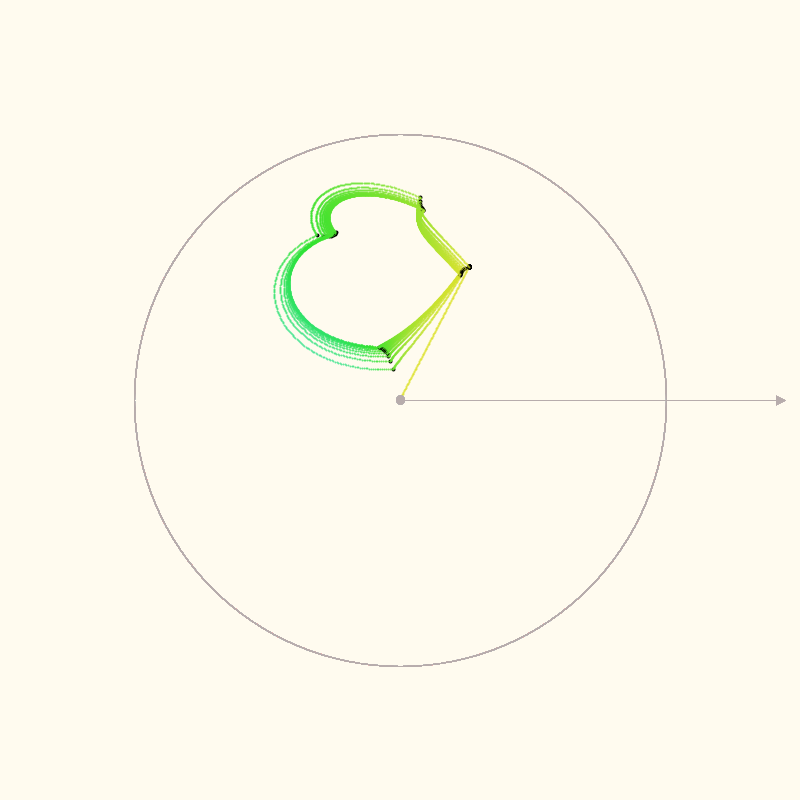
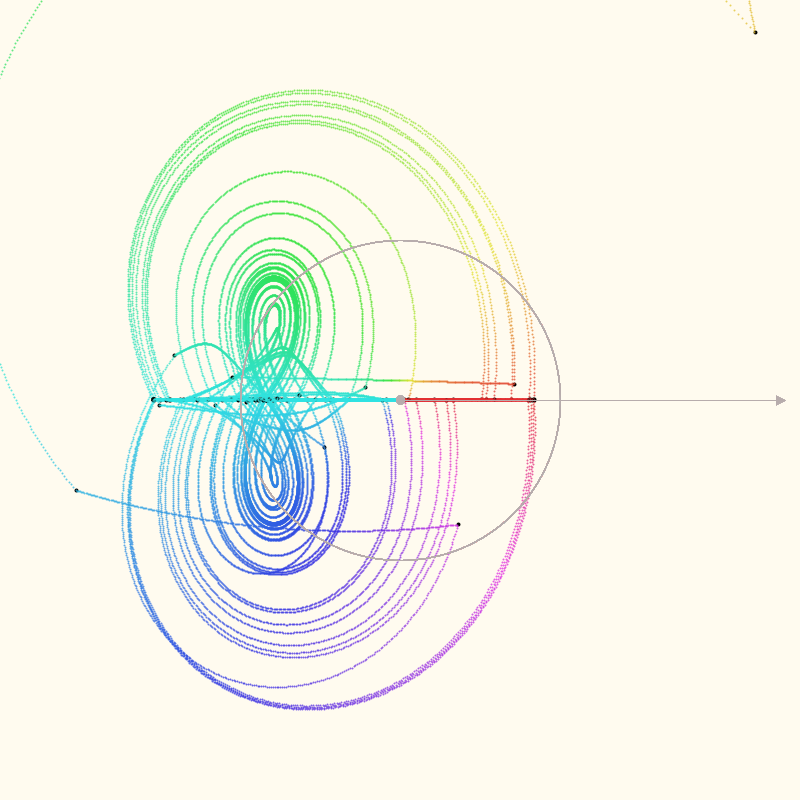
Interpolated iterations #
Since z is initialized as , the first iteration always produces a
straight line from the polar origin to :
z = z.power(z).add(c); // z = 0 at the start of the first iteration; it finishes with z = c
After the first iteration, zStart is updated to iterationTargets[0] (the value of c). Curved
paths are created as z moves towards the value that will be produced for the next iteration.
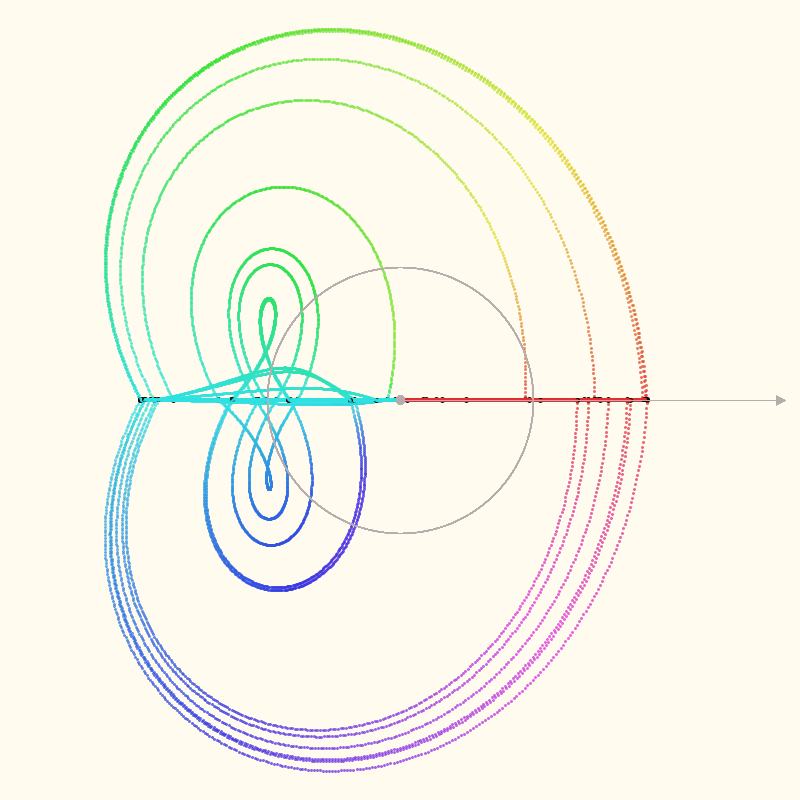
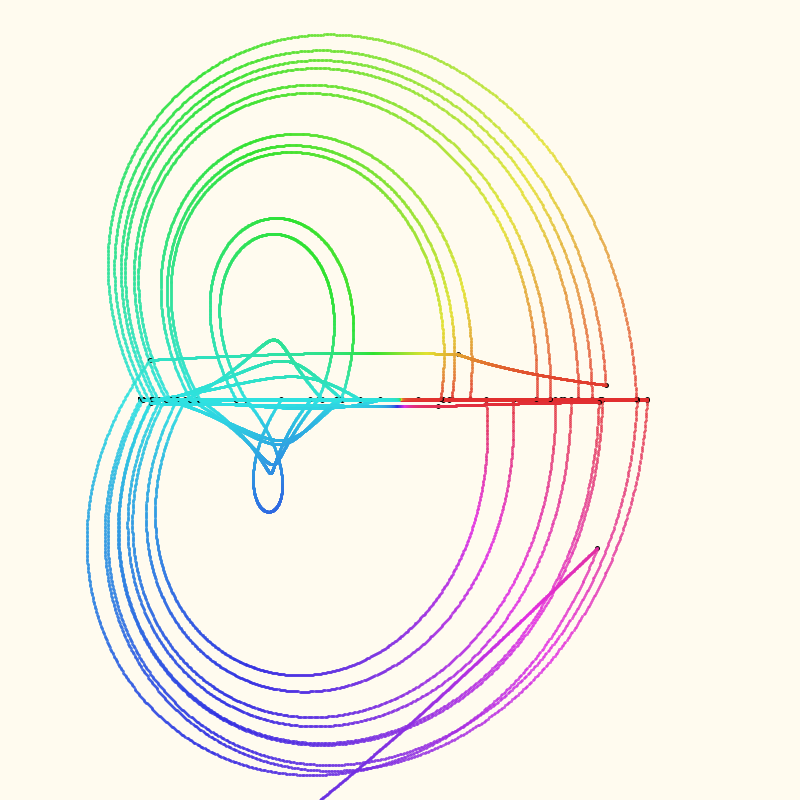
The grey circle in the images is the unit circle, centered on the polar axis. The black points are
the actual points for each z = z * z + c iteration. I’m just speculating that the intermediate
calculations are meaningful. It seems like a good guess.
The colors are mapping the angle (normalized to 0-360 degrees) to the H of a HSB color code.
I think these are right, although z is being calculated as unbound for some values where I expect
it to be bound (to be in the Mandelbrot set). If there are errors, they’re in the ComplexPolar
class’s math functions.